You can run VisIt directly on ARE VDI.
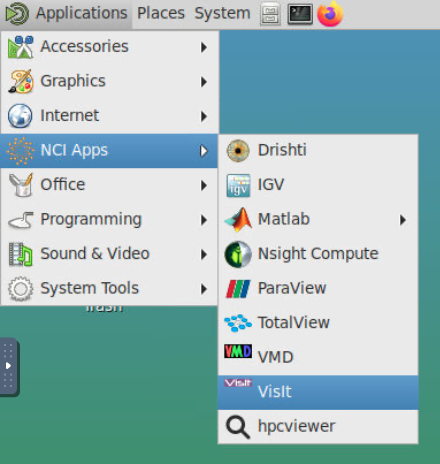
After starting a ARE VDI session, you can select "VisIt" directly from the "Applications/NCI Apps" pull-down menu as below to start VisIt
Alternatively, if you want to run VisIt in the parallel mode, you could type in the following commands in a CLI terminal of ARE VDI.
|
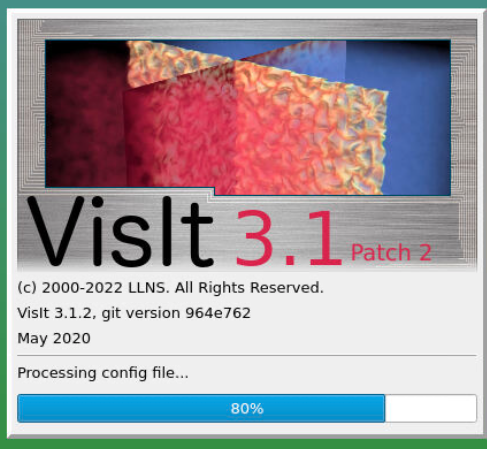
VisIt will be loaded by showing the window as below
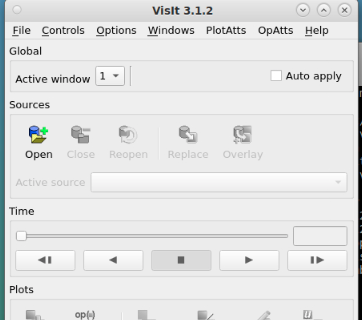
After that you can access the VisIt control window. From its 'File' menu, select 'Open File' to load a new file.
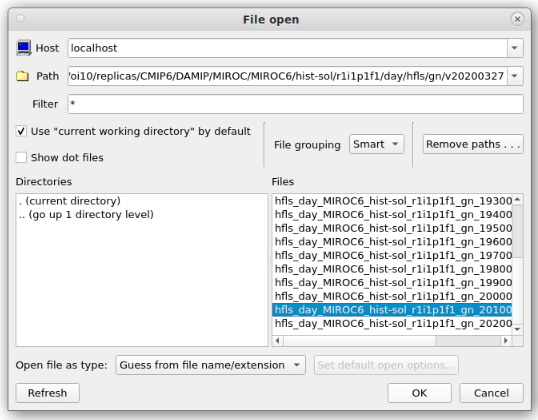
For this example, we will open a file from the CMIP6 Data Collection. This example file can be found here:
|
After navigating to the file, click "OK" to open it.
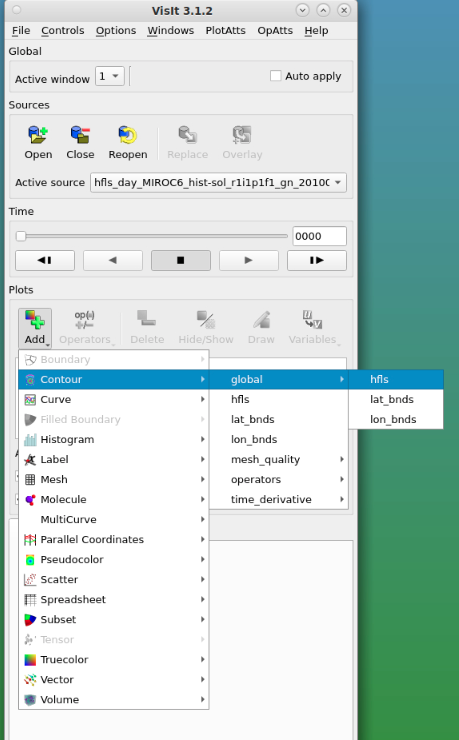
Under Plots tab, click "Add" and select "Contour>global>hfls":
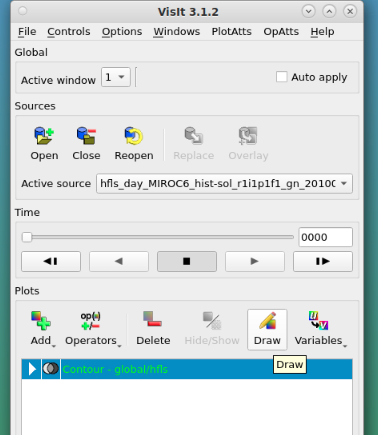
An item of the selected variable will be listed as below
Click "Draw" button you will see the variable is displayed in the main window.
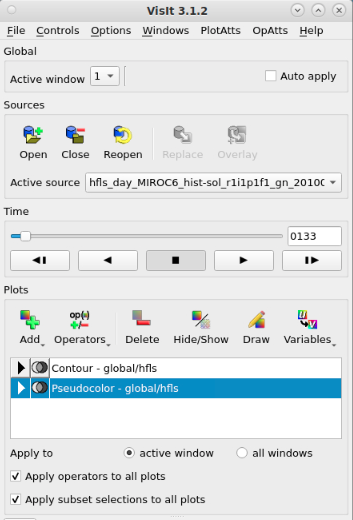
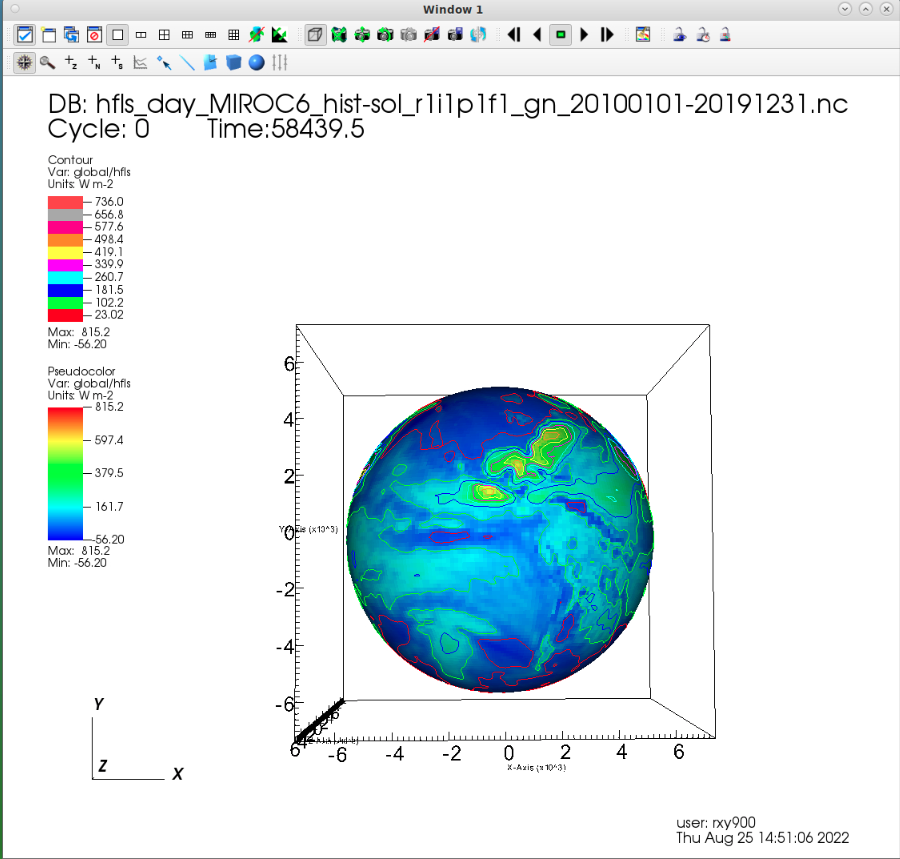
You can add/remove layers by clicking "Add" button. For example, you can select "Add>Pseudocolor>global>hfls" to add another layer in the above plot as below:
You will see the following plot
Click "Play" button in the control window you will view he variable variations along the time series:
For more details on operating VisIt, please view the Visit User Manual.
