Page History
Contents
| Anchor | ||||
|---|---|---|---|---|
|
| Table of Contents |
|---|
Compiling
Compilers and Options
Several versions of the Intel compilers are installed. These are
iccfor the C compiler,ifortfor the Fortran compiler andicpcfor the C++ compiler. To access these compilers you will need to load the relevant module. TypeCode Block language bash module avail
to see what versions of the Intel compiler are available and which is the default. Note that the C and Fortran compilers are loaded as separate modules, for example,
Code Block language bash module load intel-cc/12.1.9.293 module load intel-fc/12.1.9.293
to load a version of the Intel 12.1 compiler.
- User Guides and other documentation are available online for the Intel Fortran and C/C++ compilers. Local versions of the compiler documentation can be accessed via the software pages for Fortran and C/C++ and choosing a particular version.
- If required, the GNU compilers
gfortran,gccandg++are available. We recommend the Intel compiler for best performance for Fortran code. - Mixed language programming hints.
If your application contains both C and Fortran codes you should link as follows:
Code Block language bash icc -c cfunc.c ifort -o myprog myprog.for cfunc.o
Use the
-cxxlibcompiler option to tell the compiler to link using the C++ run-time libraries provided by gcc. By default, C++ libraries are not linked with Fortran applications.- Use the
-fexceptionscompiler option to enable C++ exception handling table generation so C++ programs can handle C++ exceptions when there are calls to Fortran routines on the call stack. This option causes additional information to be added to the object file that is required during C++ exception handling. By default, mixed Fortran/C++ applications abort in the Fortran code if a C++ exception is thrown. Use the
-nofor_maincompiler option if your C/C++ program calls an Intel Fortran subprogram, as shown:Code Block language bash icc -c cmain.c ifort -nofor_main cmain.o fsub.f90
The handling of Fortran90 modules by ifort and gfortran is incompatible – the resultant .mod and object files are not interoperable. Otherwise gfortran and ifort are generally compatible.
- The Intel C and C++ compilers are highly compatible and interoperable with GCC.
- A full list of compiler options can be obtained from the man page for each command (i.e.
man ifortorman gfortran). Some pointers to useful options for the Intel compiler are as follows:- We recommend that Intel Fortran users start with the options
-O2 -ip -fpe0. - The default
-fpesetting forifortis-fpe3which means that all floating point exceptions produce exceptional values and execution continues. To be sure that you are not getting floating point exceptions use-fpe0. This means that floating underflows are set to zero and all other exceptions cause the code to abort. If you are certain that these errors can be ignored then you can recompile with the-fpe3option. -fastsets the options-O3 -ipo -static -no-prec-div -xHoston Linux* systems and maximises speed across the entire program.- However
-fastcannot be used for MPI programs as the MPI libraries are shared, not static. To use with MPI programs use-O3 -ipo. - The
-ipooption provides interprocedural optimization but should be used with care as it does not produce the standard .o files. Do not use this if you are linking to libraries. -O0, -O1, -O2, -O3give increasing levels of optimisation from no optimization to agressive optimization. The option-Ois equivalent to-O2. Note that if-gis specified then the default optimization level is-O0.-paralleltells the auto-parallelizer to generate multithreaded code for loops that can safely be executed in parallel. This option requires that you also specify-O2or-O3. Before using this option for production work make sure that it is resulting in a worthwhile increase in speed by timing the code on a single processor then multiple processors. This option rarely gives appreciable parallel speedup.
- We recommend that Intel Fortran users start with the options
- Environment variables can be used to affect the behaviour of various programs (particularly compilers and build systems), for example
$PATH, $FC, $CFLAGS, $LD_LIBRARY_PATHand many others. Our Canonical User Environment Variables webpage has a detailed list of these variables, including information on which programs use what variables, how they are used, common misconceptions/gotchas, and so on. - Handling floating exceptions.
- The standard Intel ifort option is
-fpe3by default. All floating-point exceptions are thus disabled. Floating-point underflow is gradual, unless you explicitly specify a compiler option that enables flush-to-zero. This is the default; it provides full IEEE support. (Also see-ftz.) The option-fpe0will lead to the code aborting at errors such as divide-by-zeros. - For C++ code using
icpcthe default behaviour is to replace arithmetic exceptions withNaNs and continue the program. If you rely on seeing the arithmetic exceptions and the code aborting you will need to include thefenv.hheader and raise signals by usingfeenableexcept()function. Seeman fenvfor further details.
- The standard Intel ifort option is
- The Intel compiler provides an optimised math library,
libimf, which is linked before the standardlibmby default. If the-lmlink option is used then this behaviour changes andlibmis linked beforelibimf.
Using MPI
MPI is a parallel program interface for explicitly passing messages between parallel processes – you must have added message passing constructs to your program. Then to enable your programs to use MPI, you must include the MPI header file in your source and link to the MPI libraries when you compile.
Compiling and Linking
The preferred MPI library is Open MPI. To see what versions are available type
| Code Block | ||
|---|---|---|
| ||
module avail openmpi |
Loading the openmpi module (by typing module load openmpi for the default version or module load openmpi/<version> for version <version>) sets a variety of environment variables which you can see from
| Code Block | ||
|---|---|---|
| ||
module show openmpi # for default version module show openmpi/<version> # for version <version> |
For Fortran, compile with one of the following commands:
| Code Block | ||
|---|---|---|
| ||
ifort myprog.f -o myprog.exe $OMPI_FLIBS mpif77 myprog.f -o myprog.exe mpif90 myprog.f90 -o myprog.exe |
The environment variable $OMPI_FLIBS has been set up to insert the correct libraries for linking. These are the same as is used by the wrapper functions mpif77 and mpif90. Passing -show option in the corresponding wrapper function gives the full list of options that the wrapper passes on to the backend compiler (e.g. by typing mpif77 -show for Intel MPI gives something like ifort -I/<path>/include -L/<path>/lib -Xlinker --enable-new-dtags -Xlinker -rpath -Xlinker /<path>/lib -Xlinker -rpath -Xlinker /<path>/mpi-rt/4.1 -lmpigf -lmpi -lmpigi -ldl -lrt -lpthread). If you are using the Fortran90 bindings for MPI (unlikely), then you need $OPENMPI_F90LIBS.
For C and C++, compile with one of:
| Code Block | ||
|---|---|---|
| ||
icc -pthread myprog.c -o myprog.exe $OMPI_CLIBS mpicc myprog.c -o myprog.exe icpc -pthread myprog.C -o myprog.exe $OMPI_CXXLIBS mpiCC myprog.C -o myprog.exe |
Note that $OMPI_CXXLIBS is only relevant if you are actually using the C++ bindings for MPI. Most C++ MPI applications use the C bindings so linking with $OMPI_CLIBS is sufficient.
As mentioned above, do not use the -fast option as this sets the -static option which conflicts with using the MPI libraries which are shared libraries. Alternatively, use -03 -ipo (which is equivalent to -fast without -static).
If you do not have an Intel compiler module loaded, the MPI compiler wrappers will use the GNU compilers by default. In that case, the following pairs of commands are equivalent:
| Code Block | ||
|---|---|---|
| ||
mpif90 myprog.F gfortran myprog.F $OMPI_FLIBS mpicc myprog.c gcc -pthread myprog.c $OMPI_CLIBS mpiCC myprog.C g++ -pthread myprog.C $OMPI_CXXLIBS |
Note that that the appropriate include paths are placed in the CPATH and FPATH environment variables when you load the openmpi module.
Running MPI Jobs
To run an MPI application, you need to have an MPI module loaded in your environment. The modules of software packages requiring MPI will generally load the appropriate MPI module for you.
MPI programs are executed using the mpirun command. To run a small test with 4 processes (or tasks) where the MPI executable is called a.out, enter any of the following equivalent commands:
| Code Block | ||
|---|---|---|
| ||
mpirun -n 4 ./a.out mpirun -np 4 ./a.out |
The argument to -n or -np is the number of a.out processes that will be run.
For larger jobs and production use, submit a job to the PBS batch system with a command like the following (note that there is a carriage return after -l wd, module load openmpi and ./a.out):
| Code Block | ||
|---|---|---|
| ||
qsub -q express -l ncpus=16,walltime=20:00,mem=400mb -l wd module load openmpi mpirun ./a.out ^D (that is control-D) |
By not specifying the -np option with the batch job mpirun, mpiprun will start as many MPI processes as there have been cpus requested with qsub. It is possible to specify the number of processes on the batch job mpirun command, as mpirun -np 4 ./a.out, or more generally mpirun -np $PBS_NCPUS ./a.out.
To improve performance on the NUMA nodes of raijin, both cpu and memory binding of MPI processes is performed by default with the current default version of Open MPI. If your application requires any non-standard layout (e.g. the ranks are threaded or some ranks require very large memory) then may require options to mpirun to avoid the default binding. In the extreme case, binding can be disabled with
| Code Block | ||
|---|---|---|
| ||
mpirun --bind-to-none -np 4 ./a.out |
however there may be more appropriate options.
Using OpenMP
OpenMP is an extension to standard Fortran, C and C++ to support shared memory parallel execution. Directives have to be added to your source code to parallelise loops and specify certain properties of variables. (Note that OpenMP and Open MPI are unrelated.)
Compiling and Linking
Fortran with OpenMP directives is compiled as:
| Code Block | ||
|---|---|---|
| ||
ifort -openmp myprog.f -o myprog.exe gfortran -fopenmp myprog.f -o myprog.exe |
C code with OpenMP directives is compiled as:
| Code Block | ||
|---|---|---|
| ||
icc -openmp myprog.c -o myprog.exe gcc -fopenmp myprog.c -o myprog.exe |
Running OpenMP Jobs
To run the OpenMP job interactively, first set the OMP_NUM_THREADS environment variable, then run the executable as shown below:
| Code Block | ||
|---|---|---|
| ||
export OMP_NUM_THREADS=16 # for bash shell (default on Raijin) ./a.out |
or| Code Block | ||
|---|---|---|
| ||
setenv OMP_NUM_THREADS 16 # for csh or tcsh shell ./a.out |
For larger jobs and production use, submit a job to the PBS batch system with something like
| Code Block | ||
|---|---|---|
| ||
qsub -q normal -l nodes=1:ppn=16,walltime=20:00,mem=400mb -l wd #!/bin/csh setenv OMP_NUM_THREADS $PBS_NCPUS ./a.out ^D (that is control-D) |
OpenMP is a shared memory parallelism model – only one host (node) can be used to execute an OpenMP application. The clusters have nodes with 16 cpu cores. It makes no sense to try to run an OpenMP application on more than 16 processes. Note that in the above qsub example, the request specifies 1 node and the number of “processors per node” (ppn) required.
You should time your OpenMP code on a single processor then on increasing numbers of CPUs to find the optimal number of processors for running it. Keep in mind that your job is charged ncpus*walltime.
Since each Raijin node has 2 processor sockets each with 8 cores (i.e. a total of 16 cores), it makes more sense to run one MPI process per processor socket. For the probable best performance of an OpenMP application on Raijin, the configuration is: launching 1 MPI process per socket, binding 8 cores per MPI process (binding to socket), running 8 OMP threads per MPI process and launching 2 MPI processes per node. Executing something like the following (openmpi module may vary):
| Code Block | ||
|---|---|---|
| ||
qsub -q normal omp_job_script.bash |
where omp_job_script.bash is as follows:
| Code Block | ||
|---|---|---|
| ||
#!/bin/bash #PBS -l ncpus=16 #PBS -l walltime=20:00 #PBS -l mem=400mb #PBS -l wd module load openmpi CORES_PER_SOCKET=8 NPROC=`expr $PBS_NCPUS / $CORES_PER_SOCKET` export OMP_NUM_THREADS=$CORES_PER_SOCKET export GOMP_CPU_AFFINITY=0-15 OMP_PARAM="-cpus-per-proc $OMP_NUM_THREADS -npersocket 1 -x OMP_NUM_THREADS -x GOMP_CPU_AFFINITY" mpirun -np $NPROC $OMP_PARAM ./a.out |
OpenMP Performance
Parallel loop overheads
There is an overhead in starting and ending any parallel work distribution construct – an empty parallel loop takes a lot longer than an empty serial loop. And that overhead in wasted time grows with the number of threads used. Meanwhile the time to do the real work has (hopefully) decreased by using more threads. So you can end up with timelines like the following for a parallel work distribuition region:
              4 cpus             8 cpus

       time    ---- ---- | startup startup | ---- V ---- work work ____ ____ cleanup cleanup ---- ----
        |     startup            startup
        |      ----
        V                         ----
               work               work

                                  ____
               ____              cleanup
              cleanup             ----
               ----
Bottom line: the amount of work in a parallel loop (or section) has to be large compared with the startup time. You’re looking at 10’s of microseconds startup cost or the equivalent time for doing 1000’s of floating point ops. Given another order-of-magnitude because you’re splitting work over O(10) threads and at least another order-of-magnitude because you want the work to dominate over startup cost and very quickly you need O(million) ops in a parallelised loop to make it scale OK.
Common Problems
- One of the most common problems encountered after parallelizing a code is the generation of floating point exceptions or segmentation violations that were not occurring before. This is usually due to uninitialised variables – check your code very carefully.
Segmentation violations can also be caused by the thread stack size being too small. Change this by setting the environment variable OMP_STACKSIZE, for example,
Code Block language bash export OMP_STACKSIZE="10M"
Code Development
Debugging
Intel debugger
The Intel
idb debugger for C, C++ and Fortran as well as GNU C/C++ can be used in either DBX or GDB mode. It supports the debugging of simple programs, core files and code with multiple threads. The GNU debugger gdb is also available. Read man idb for further information.To use first compile and link your program using the
-gswitch e.g.Code Block language bash cc -g prog.c
Start the debugger
Code Block language bash idbc ./a.out
Enter commands such as
Code Block language bash ... (idb) list (idb) stop at 10 (idb) run (idb) print variable ... (idb) quit
- By starting
idbup with the option-gui(i.e.idbc -gui) you get a useful graphical user interface.
Coredump files
By default your jobs will not produce coredump files when they crash. To generate corefiles you need:
| Code Block | ||
|---|---|---|
| ||
limit coredumpsize unlimited (for tcsh) ulimit -c unlimited (for bash) |
Also if you are using the Intel Fortran compiler, you will will need
| Code Block | ||
|---|---|---|
| ||
setenv decfort_dump_flag y (for tcsh) export decfort_dump_flag=y (for bash) |
To use the coredump file, enter
| Code Block | ||
|---|---|---|
| ||
gdb /path/to/the/executable /path/to/the/coredumpfile ... (gdb) where (gdb) bt (gdb) frame number (gdb) list (gdb) info locals (gdb) print variable ... (gdb) quit |
Coredump files can take up a lot of disk space especially from a large parallel job – be careful not to generate them if you are not going to use them.
Debugging Parallel Programs
Totalview can be used to debug parallel MPI or OpenMP programs. Introductory information and userguides on using Totalview are available from this site.
Load module to use Totalview,
Code Block language bash module load totalview
Compile code with the
-goption. For example, for an MPI program,Code Block language bash mpif90 -g prog.f
Start Totalview. For example, to debug an MPI program using 4 processors the usual command is,
Code Block language bash mpirun --debug -np 4 ./a.out
as mpirun is a locally written wrapper.
Note that to ensure that Totalview can obtain information on all variables compile with no optimisation. This is the default if -g is used with no specific optimisation level.
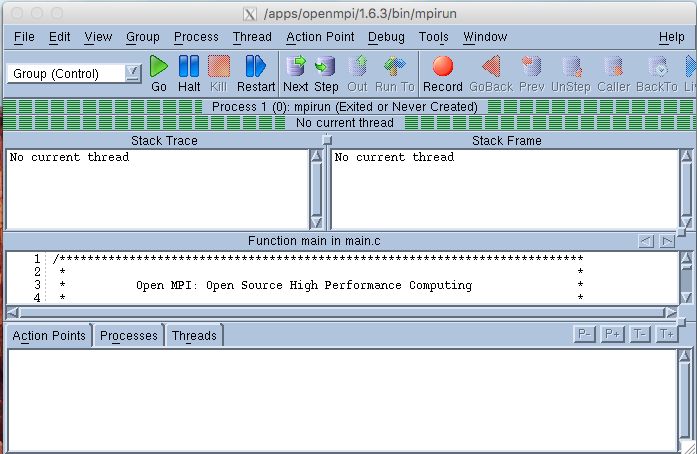
Totalview shows source code for mpirun when it first starts an MPI job. A GUI like the following is generated. Click on GO and all the processes will start up and you will be asked if you want to stop the parallel job. At this point click YES if you want to insert breakpoints. The source code will be shown and you can click on any lines where you wish to stop.
If your source code is in a different directory from where you fired up Totalview you may need to add the path to Search Path under the File Menu. Right clicking on any subroutine name will “dive” into the source code for that routine and break points can be set there.
The procedure for viewing variables in an MPI job is a little complicated. If your code has stopped at a breakpoint right click on the variable or array of interest in the stack frame window. If the variable cannot be displayed then choose “Add to expression list” and the variable will appear listed in a new window. If it is marked “Invalid compilation scope” in this new window right click again on the variable name in this window and chose “Compilation scope”. Change this to “Floating” and the value of the variable or array should appear. Right clicking on it again and chosing “Dive” will give you values for arrays. In this window you can chose “Laminate” then “Process” under the View menu to see the values on different processors.
Under the Tools option on the top toolbar of the window displaying the variable values you can choose Visualise to display the data graphically which can be useful for large arrays.
It is also possible to use Totalview for memory debugging, showing graphical representations of outstanding messages in MPI or setting action points based on evaluation of a user defined expression. See the Totalview User Guide for more information.
Alternatively, PADB, a light weight parallel program inspection/debug tool, is also available in NCI compute systems. For more information on its usage, please refer to Parallel Program Debugging User Guide.
For more information on memory debugging see here.
Notes on Benchmarking
Before running MPI jobs on many processors you should run some smaller benchmarking and timing tests to see how well your application scales. There is an art to this and the following points are things you should consider when setting up timing examples. For scaling tests you need a typically sized problem that does not take too long to run. So, for example, it may be possible to time just a few iterations of your application. Test runs should be replicated several times as there will be some variation in timings.
- NUMA page placement:
If the memory of a node is not empty when a job starts on it, there is a chance that pages will be placed badly. (Suspend/resume is an obvious “cause” of this problem but even after exiting, a job can leave a memory footprint (pagecache) meaning “idle” nodes can also cause problems.) A locally written modification to Open MPI 1.4.3 (now the default version of Open MPI) has memory binding set by default. Ask for help if you think you need this turned off. The good news is that the Open MPI developers will support memory binding in future releases.
Fix: Use Open MPI 1.4.3 or later. - Paging overhead:
Because of suspend/resume, there is a high probability that any reasonable size parallel job will have to (partially) page out at least some suspended jobs when starting up. In the worst case, this could take up to the order of a minute. In the case of a 3hr production job this is not an issue but it is significant for a 10 minute test job. There are various ways to avoid this:- just use the walltime of some later iteration/timestep as the benchmark measure and ignore the first couple of iterations
- run the mpirun command 2 or 3 times in the one PBS job and use the last run for timing. The first runs should be about a minute long.
- run “mpirun memhog size” where size is the real memory required per MPI task (takes an “m” or “g” suffix). Beware of causing excessive paging or getting your job killed by PBS by trying to memhog too much memory.
Fix: Clear memory for the job as above.
- Network interactions and locality:
Generally small and hard to avoid except in special cases. The scheduler does try to impose some degree of locality but that could be strengthened. It should also be possible to add a qsub option to request best locality. But the job would probably queue longer and could still see issues. For example we regularly have InfiniBand links down and, with IB static routing, that means some links are doing double duty.
Fix: New PBS option to request best locality or live with it. - IO interactions with other jobs:
This is almost impossible to control. There is usually lots of scope for tuning IO (both at the system level and in the job) so it certainly shouldn’t be ignored. But for benchmarking purposes:
Fix: do as little IO as possible and test the IO part separately. - Communication startup:
MPI communication is connection based meaning there is a fair amount of negotiation before the first message can be sent. There are ways to control when and how this happens (look for “mpi_preconnect_” in the output from “ompi_info -a”) but you cannot avoid this overhead.
Fix: try to discount or quantify the startup cost as discussed above.
Profiling
gprof
The gprof profiling tool is available for sequential codes.
The
gprofprofiler provides information on the most time-consuming subprograms in your code. Profiling the executableprog.exewill lead to profiling data being stored ingmon.outwhich can then be interpreted bygprofas follows:Code Block language bash ifort -p -o prog.exe prog.f ./prog.exe gprof ./prog.exe gmon.out
For the GNU compilers do
Code Block language bash gfortran -pg -o prog.exe prog.f gprof ./prog.exe gmon.out
gprof is not useful for parallel code, HPCToolKit will be used instead. More information on profiling for parallel code is available General Performance Analysis User Guide.
Graphical Profiling of MPI Code
Two lightweight MPI profilers, IPM and mpiP, are available for Open MPI parallel codes. A minimal user instruction is described below. For more detailed user guide, please refer MPI Performance Analysis User Guide.
IPM
ipm/0.983-nci- works with
openmpi/1.6.5or less - gives nice graph with communication pattern
- works with
ipm/0.983-cache- works with
openmpi/1.6.5or less - gives
L1 L2 L3cache misses
- works with
ipm/2.0.2- only works with
openmpi/1.7.*and1.8.* - the only version gives flops
- only works with
ipm/2.0.5- works with
openmpi/1.10.2
Code Block language bash module load openmpi module load ipm mpirun ./prog.exe
To view the IPM profile results (usually in the format of username.xxxxxxxxxx.xxxxxx.0):
Code Block language bash ssh -X abc123@raijin.nci.org.au (to enable remote display) ipm_view username.xxxxxxxxxx.xxxxxx.0
- works with
- mpiP
mpiP/3.2.1mpiP/3.4.1Code Block language bash mpicc -g -o prog.exe prog.c (optional) module load openmpi module load mpiP mpirun -np $n ./prog.exe
To view the mpiP profile results (usually in the format of prog.exe.${n}.xxxxx.x.mpiP):
Code Block language bash ssh -X abc123@raijin.nci.org.au (to enable remote display) mpipview prog.exe.${n}.xxxxx.x.mpiP
...
Overview
Content Tools